
Lord Dan Hannan
Never in all the years since this Index was first published has the news been so unremittingly depressing. The last time the world saw a swing away from free trade on anything like this scale, years of horror followed: the Depression, the rise of the dictators, the Holodomor, the Holocaust.
Then, the chief beneficiary of the old open commercial system (the United Kingdom) moved late and reluctantly to protectionism. This time, the chief beneficiary (the United States) is leading the charge.
Overall, the Index ranks the US 61st, a poor position reflecting its relatively few trade deals, its fondness for protectionist actions at the WTO and its maintenance of a range of non-tariff barriers. But that ranking does not reflect the new tariff lines announced by President Trump on April 2, 2025. If those barriers remain in place – and, as I write, the issue remains uncertain – then the
Read The Full Foreword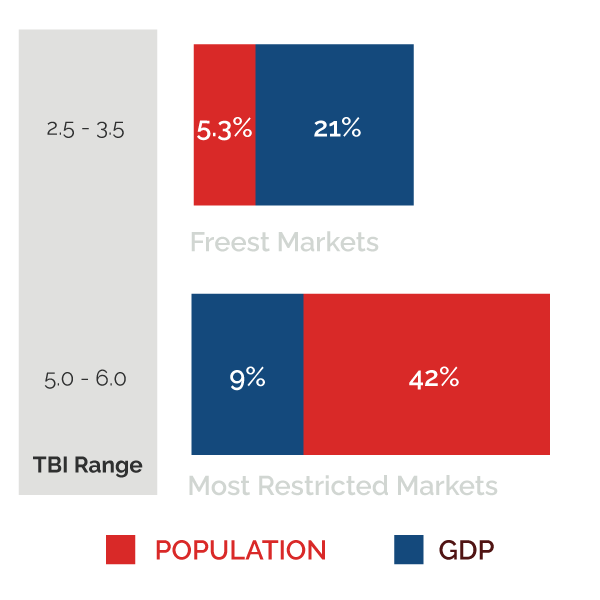
Only 5.35% of the world’s people live in the freest markets where they produce 21% of global GDP! The most restricted markets are home to 42% of world’s population, but the produce only 9% of global GDP.

Western Europe led in imposing Digital Trade Barriers, including digital taxes, content moderation, and data flow restrictions.
Only 5.35% of the world’s people live in the freest markets where they produce 21% of global GDP! The most restricted markets are home to 42% of world’s population, but the produce only 9% of global GDP.
Western Europe led in imposing Digital Trade Barriers, including digital taxes, content moderation, and data flow restrictions.
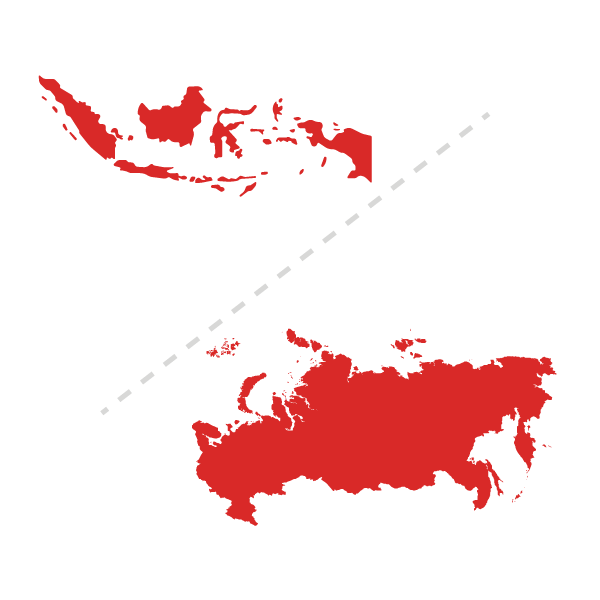
India and Russia deployed the most trade barriers greatly restricting trade and imposing other economic and social costs.
Lower trade barriers are strongly associated with prosperity & freedom; higher trade barriers with corruption & abuse of press.

Non-Tariff Barriers are commonly used by High Income countries to restrict trade, whereas other income groups tend to distort trade with Tariffs and Services Restrictions.
India and Russia deployed the most trade barriers greatly restricting trade and imposing other economic and social costs.
Lower trade barriers are strongly associated with prosperity & freedom; higher trade barriers with corruption & abuse of press.
Non-Tariff Barriers are commonly used by High Income countries to restrict trade, whereas other income groups tend to distort trade with Tariffs and Services Restrictions.
| Name | Region | Income | Score | Global Rank |
Regional Rank |
Year | ||
|---|---|---|---|---|---|---|---|---|
All Countries - Click on a country's name to see its individual profile page.
| Name | Region | Income | Score | Global Rank |
Regional Rank |
Year | ||
|---|---|---|---|---|---|---|---|---|
| Singapore | East Asia & Pacific | High Income | 2.7 | 1 | 1 | 2019 | Compare | |
| Hong Kong | East Asia & Pacific | High Income | 2.83 | 2 | 2 | 2019 | Compare | |
| New Zealand | East Asia & Pacific | High Income | 2.86 | 3 | 3 | 2019 | Compare | |
| Netherlands | Western Europe | High Income | 2.93 | 4 | 1 | 2019 | Compare | |
| Sweden | Western Europe | High Income | 3.07 | 5 | 2 | 2019 | Compare | |
| Ireland | Western Europe | High Income | 3.13 | 6 | 3 | 2019 | Compare | |
| Poland | Western Europe | High Income | 3.15 | 7 | 4 | 2019 | Compare | |
| United Kingdom | Western Europe | High Income | 3.17 | 8 | 5 | 2019 | Compare | |
| Luxembourg | Western Europe | High Income | 3.21 | 9 | 6 | 2019 | Compare | |
| Canada | North America | High Income | 3.21 | 10 | 1 | 2019 | Compare | |
| Belgium | Western Europe | High Income | 3.22 | 11 | 7 | 2019 | Compare | |
| Germany | Western Europe | High Income | 3.23 | 12 | 8 | 2019 | Compare | |
| Finland | Western Europe | High Income | 3.23 | 13 | 9 | 2019 | Compare | |
| Czech Republic | Western Europe | High Income | 3.26 | 14 | 10 | 2019 | Compare | |
| Austria | Western Europe | High Income | 3.3 | 15 | 11 | 2019 | Compare | |
| Denmark | Western Europe | High Income | 3.3 | 16 | 12 | 2019 | Compare | |
| Australia | East Asia & Pacific | High Income | 3.32 | 17 | 4 | 2019 | Compare | |
| Estonia | Western Europe | High Income | 3.32 | 18 | 13 | 2019 | Compare | |
| Switzerland | Western Europe | High Income | 3.33 | 19 | 14 | 2019 | Compare | |
| Israel | Middle East and North Africa | High Income | 3.35 | 20 | 1 | 2019 | Compare | |
| Lithuania | Western Europe | High Income | 3.36 | 21 | 15 | 2019 | Compare | |
| Portugal | Western Europe | High Income | 3.38 | 22 | 16 | 2019 | Compare | |
| Slovenia | Western Europe | High Income | 3.39 | 23 | 17 | 2019 | Compare | |
| Cyprus | Western Europe | High Income | 3.41 | 24 | 18 | 2019 | Compare | |
| Malta | Western Europe | High Income | 3.41 | 25 | 19 | 2019 | Compare | |
| France | Western Europe | High Income | 3.42 | 26 | 20 | 2019 | Compare | |
| Spain | Western Europe | High Income | 3.43 | 27 | 21 | 2019 | Compare | |
| Brunei Darussalam | South Asia | High Income | 3.45 | 28 | 1 | 2019 | Compare | |
| Romania | Western Europe | Upper Middle Income | 3.45 | 29 | 22 | 2019 | Compare | |
| Slovak Republic | Western Europe | High Income | 3.46 | 30 | 23 | 2019 | Compare | |
| Hungary | Western Europe | High Income | 3.48 | 31 | 24 | 2019 | Compare | |
| Peru | Latin America & Caribbean | Upper Middle Income | 3.48 | 32 | 1 | 2019 | Compare | |
| Bulgaria | Western Europe | Upper Middle Income | 3.49 | 33 | 25 | 2019 | Compare | |
| Greece | Western Europe | High Income | 3.5 | 34 | 26 | 2019 | Compare | |
| Latvia | Western Europe | High Income | 3.53 | 35 | 27 | 2019 | Compare | |
| Croatia | Western Europe | High Income | 3.55 | 36 | 28 | 2019 | Compare | |
| Italy | Western Europe | High Income | 3.6 | 37 | 29 | 2019 | Compare | |
| Chile | Latin America & Caribbean | High Income | 3.63 | 38 | 2 | 2019 | Compare | |
| Japan | East Asia & Pacific | High Income | 3.66 | 39 | 5 | 2019 | Compare | |
| Honduras | Latin America & Caribbean | Lower Middle Income | 3.76 | 40 | 3 | 2019 | Compare | |
| Colombia | Latin America & Caribbean | Upper Middle Income | 3.77 | 41 | 4 | 2019 | Compare | |
| South Africa | Sub-Saharan Africa | Upper Middle Income | 3.89 | 42 | 1 | 2019 | Compare | |
| Jordan | Middle East and North Africa | Upper Middle Income | 3.91 | 43 | 2 | 2019 | Compare | |
| Trinidad And Tobago | Latin America & Caribbean | High Income | 3.91 | 44 | 5 | 2019 | Compare | |
| Guatemala | Latin America & Caribbean | Upper Middle Income | 3.93 | 45 | 6 | 2019 | Compare | |
| Ecuador | Latin America & Caribbean | Upper Middle Income | 4.03 | 46 | 7 | 2019 | Compare | |
| Qatar | Middle East and North Africa | High Income | 4.07 | 47 | 3 | 2019 | Compare | |
| Panama | Latin America & Caribbean | High Income | 4.07 | 48 | 8 | 2019 | Compare | |
| Oman | Middle East and North Africa | High Income | 4.11 | 49 | 4 | 2019 | Compare | |
| Sri Lanka | South Asia | Lower Middle Income | 4.14 | 50 | 2 | 2019 | Compare | |
| Costa Rica | Latin America & Caribbean | Upper Middle Income | 4.16 | 51 | 9 | 2019 | Compare | |
| Ghana | Sub-Saharan Africa | Lower Middle Income | 4.17 | 52 | 2 | 2019 | Compare | |
| Paraguay | Latin America & Caribbean | Upper Middle Income | 4.25 | 53 | 10 | 2019 | Compare | |
| United States | North America | High Income | 4.26 | 54 | 2 | 2019 | Compare | |
| Malaysia | East Asia & Pacific | Upper Middle Income | 4.28 | 55 | 6 | 2019 | Compare | |
| Uruguay | Latin America & Caribbean | High Income | 4.3 | 56 | 11 | 2019 | Compare | |
| Nigeria | Sub-Saharan Africa | Lower Middle Income | 4.31 | 57 | 3 | 2019 | Compare | |
| Mexico | Latin America & Caribbean | Upper Middle Income | 4.32 | 58 | 12 | 2019 | Compare | |
| Kuwait | Middle East and North Africa | High Income | 4.32 | 59 | 5 | 2019 | Compare | |
| Senegal | Sub-Saharan Africa | Low Income | 4.33 | 60 | 4 | 2019 | Compare | |
| Bolivia | Latin America & Caribbean | Lower Middle Income | 4.37 | 61 | 13 | 2019 | Compare | |
| Bahrain | Middle East and North Africa | High Income | 4.37 | 62 | 6 | 2019 | Compare | |
| Lebanon | Middle East and North Africa | Upper Middle Income | 4.39 | 63 | 7 | 2019 | Compare | |
| Saudi Arabia | Middle East and North Africa | High Income | 4.42 | 64 | 8 | 2019 | Compare | |
| Kazakhstan | Central Eastern Europe and Central Asia | Upper Middle Income | 4.44 | 65 | 1 | 2019 | Compare | |
| Vietnam | East Asia & Pacific | Lower Middle Income | 4.53 | 67 | 7 | 2019 | Compare | |
| Russian | Central Eastern Europe and Central Asia | Upper Middle Income | 4.57 | 68 | 2 | 2019 | Compare | |
| Cameroon | Sub-Saharan Africa | Lower Middle Income | 4.53 | 66 | 5 | 2019 | Compare | |
| Pakistan | Middle East and North Africa | Lower Middle Income | 4.6 | 69 | 9 | 2019 | Compare | |
| Côte D'ivoire | Sub-Saharan Africa | Lower Middle Income | 4.67 | 70 | 6 | 2019 | Compare | |
| Argentina | Latin America & Caribbean | High Income | 4.79 | 71 | 14 | 2019 | Compare | |
| Indonesia | East Asia & Pacific | Lower Middle Income | 4.8 | 72 | 8 | 2019 | Compare | |
| Korea, Rep. | East Asia & Pacific | High Income | 4.84 | 73 | 9 | 2019 | Compare | |
| Tunisia | Middle East and North Africa | Lower Middle Income | 4.93 | 74 | 10 | 2019 | Compare | |
| Mali | Sub-Saharan Africa | Low Income | 4.93 | 75 | 7 | 2019 | Compare | |
| Bangladesh | Middle East and North Africa | Lower Middle Income | 4.95 | 76 | 11 | 2019 | Compare | |
| Brazil | Latin America & Caribbean | Upper Middle Income | 5.02 | 77 | 15 | 2019 | Compare | |
| Philippines | East Asia & Pacific | Lower Middle Income | 5.08 | 78 | 10 | 2019 | Compare | |
| Turkey | Central Eastern Europe and Central Asia | Upper Middle Income | 5.09 | 79 | 3 | 2019 | Compare | |
| Morocco | Middle East and North Africa | Lower Middle Income | 5.16 | 80 | 12 | 2019 | Compare | |
| Nepal | South Asia | Low Income | 5.16 | 81 | 3 | 2019 | Compare | |
| Venezuela | Latin America & Caribbean | Upper Middle Income | 5.21 | 82 | 16 | 2019 | Compare | |
| Thailand | East Asia & Pacific | Upper Middle Income | 5.5 | 83 | 11 | 2019 | Compare | |
| Algeria | Middle East and North Africa | Upper Middle Income | 5.61 | 84 | 13 | 2019 | Compare | |
| China | East Asia & Pacific | Upper Middle Income | 5.96 | 85 | 12 | 2019 | Compare | |
| India | South Asia | Lower Middle Income | 6.01 | 86 | 4 | 2019 | Compare | |
| Algeria | Middle East and North Africa | Upper Middle Income | 6.06 | 89 | 14 | 2021 | Compare | |
| Argentina | Latin America & Caribbean | High Income | 4.74 | 71 | 14 | 2021 | Compare | |
| Australia | East Asia & Pacific | High Income | 3.13 | 12 | 4 | 2021 | Compare | |
| Austria | Western Europe | High Income | 3.25 | 18 | 12 | 2021 | Compare | |
| Bahrain | Middle East and North Africa | High Income | 4.2 | 52 | 5 | 2021 | Compare | |
| Bangladesh | Middle East and North Africa | Lower Middle Income | 5.04 | 79 | 12 | 2021 | Compare | |
| Belgium | Western Europe | High Income | 3.05 | 8 | 4 | 2021 | Compare | |
| Bolivia | Latin America & Caribbean | Lower Middle Income | 4.65 | 68 | 13 | 2021 | Compare | |
| Botswana | Sub-Saharan Africa | Upper Middle Income | 4.37 | 58 | 5 | 2021 | Compare | |
| Brazil | Latin America & Caribbean | Upper Middle Income | 5.18 | 83 | 15 | 2021 | Compare | |
| Bulgaria | Western Europe | Upper Middle Income | 3.49 | 28 | 22 | 2021 | Compare | |
| Cameroon | Sub-Saharan Africa | Lower Middle Income | 4.88 | 74 | 8 | 2021 | Compare | |
| Canada | North America | High Income | 2.99 | 6 | 1 | 2021 | Compare | |
| Chile | Latin America & Caribbean | High Income | 3.54 | 33 | 2 | 2021 | Compare | |
| China | East Asia & Pacific | Upper Middle Income | 5.71 | 88 | 12 | 2021 | Compare | |
| Colombia | Latin America & Caribbean | Upper Middle Income | 3.75 | 40 | 4 | 2021 | Compare | |
| Costa Rica | Latin America & Caribbean | Upper Middle Income | 4.22 | 54 | 9 | 2021 | Compare | |
| Côte D'ivoire | Sub-Saharan Africa | Lower Middle Income | 4.9 | 75 | 9 | 2021 | Compare | |
| Croatia | Western Europe | High Income | 3.6 | 37 | 28 | 2021 | Compare | |
| Cyprus | Western Europe | High Income | 3.52 | 32 | 24 | 2021 | Compare | |
| Czech Republic | Western Europe | High Income | 3.17 | 14 | 9 | 2021 | Compare | |
| Denmark | Western Europe | High Income | 3.2 | 15 | 10 | 2021 | Compare | |
| Ecuador | Latin America & Caribbean | Upper Middle Income | 3.75 | 41 | 5 | 2021 | Compare | |
| Egypt | Middle East and North Africa | Lower Middle Income | 5.23 | 84 | 13 | 2021 | Compare | |
| Estonia | Western Europe | High Income | 3.43 | 27 | 21 | 2021 | Compare | |
| Finland | Western Europe | High Income | 3.08 | 10 | 7 | 2021 | Compare | |
| France | Western Europe | High Income | 3.32 | 21 | 16 | 2021 | Compare | |
| Germany | Western Europe | High Income | 3.15 | 13 | 8 | 2021 | Compare | |
| Ghana | Sub-Saharan Africa | Lower Middle Income | 4.5 | 64 | 7 | 2021 | Compare | |
| Greece | Western Europe | High Income | 3.49 | 29 | 23 | 2021 | Compare | |
| Guatemala | Latin America & Caribbean | Upper Middle Income | 4.49 | 63 | 12 | 2021 | Compare | |
| Honduras | Latin America & Caribbean | Lower Middle Income | 4.01 | 49 | 7 | 2021 | Compare | |
| Hong Kong | East Asia & Pacific | High Income | 3.01 | 7 | 3 | 2021 | Compare | |
| Hungary | Western Europe | High Income | 3.42 | 26 | 20 | 2021 | Compare | |
| India | South Asia | Lower Middle Income | 6.44 | 90 | 3 | 2021 | Compare | |
| Indonesia | East Asia & Pacific | Lower Middle Income | 5.08 | 80 | 9 | 2021 | Compare | |
| Ireland | Western Europe | High Income | 3.07 | 9 | 5 | 2021 | Compare | |
| Italy | Western Europe | High Income | 3.54 | 34 | 25 | 2021 | Compare | |
| Japan | East Asia & Pacific | High Income | 3.49 | 30 | 5 | 2021 | Compare | |
| Jordan | Middle East and North Africa | Upper Middle Income | 3.89 | 45 | 2 | 2021 | Compare | |
| Kazakhstan | Central Eastern Europe and Central Asia | Upper Middle Income | 4.58 | 66 | 2 | 2021 | Compare | |
| Kenya | Sub-Saharan Africa | Lower Middle Income | 4.43 | 60 | 6 | 2021 | Compare | |
| Korea, Rep. | East Asia & Pacific | High Income | 4.83 | 73 | 8 | 2021 | Compare | |
| Kuwait | Middle East and North Africa | High Income | 4.58 | 67 | 7 | 2021 | Compare | |
| Latvia | Western Europe | High Income | 3.64 | 38 | 29 | 2021 | Compare | |
| Lebanon | Middle East and North Africa | Upper Middle Income | 4.8 | 72 | 9 | 2021 | Compare | |
| Lithuania | Western Europe | High Income | 3.34 | 23 | 17 | 2021 | Compare | |
| Luxembourg | Western Europe | High Income | 3.27 | 19 | 13 | 2021 | Compare | |
| Malaysia | East Asia & Pacific | Upper Middle Income | 4.21 | 53 | 6 | 2021 | Compare | |
| Mali | Sub-Saharan Africa | Low Income | 5.15 | 82 | 10 | 2021 | Compare | |
| Malta | Western Europe | High Income | 3.59 | 35 | 26 | 2021 | Compare | |
| Mauritius | Sub-Saharan Africa | High Income | 3.2 | 16 | 1 | 2021 | Compare | |
| Mexico | Latin America & Caribbean | Upper Middle Income | 4.37 | 59 | 11 | 2021 | Compare | |
| Morocco | Middle East and North Africa | Lower Middle Income | 5.02 | 78 | 11 | 2021 | Compare | |
| Nepal | South Asia | Low Income | 5.41 | 86 | 2 | 2021 | Compare | |
| Netherlands | Western Europe | High Income | 2.76 | 3 | 1 | 2021 | Compare | |
| New Zealand | East Asia & Pacific | High Income | 2.71 | 2 | 2 | 2021 | Compare | |
| Nigeria | Sub-Saharan Africa | Lower Middle Income | 4.35 | 57 | 4 | 2021 | Compare | |
| Oman | Middle East and North Africa | High Income | 3.94 | 47 | 4 | 2021 | Compare | |
| Pakistan | Middle East and North Africa | Lower Middle Income | 4.68 | 69 | 8 | 2021 | Compare | |
| Panama | Latin America & Caribbean | High Income | 3.96 | 48 | 6 | 2021 | Compare | |
| Paraguay | Latin America & Caribbean | Upper Middle Income | 4.13 | 50 | 8 | 2021 | Compare | |
| Peru | Latin America & Caribbean | Upper Middle Income | 3.49 | 31 | 1 | 2021 | Compare | |
| Philippines | East Asia & Pacific | Lower Middle Income | 5.09 | 81 | 10 | 2021 | Compare | |
| Poland | Western Europe | High Income | 3.08 | 11 | 6 | 2021 | Compare | |
| Portugal | Western Europe | High Income | 3.32 | 22 | 15 | 2021 | Compare | |
| Qatar | Middle East and North Africa | High Income | 3.93 | 46 | 3 | 2021 | Compare | |
| Romania | Western Europe | Upper Middle Income | 3.37 | 24 | 18 | 2021 | Compare | |
| Russian | Central Eastern Europe and Central Asia | Upper Middle Income | 4.68 | 70 | 3 | 2021 | Compare | |
| Saudi Arabia | Middle East and North Africa | High Income | 4.48 | 61 | 6 | 2021 | Compare | |
| Senegal | Sub-Saharan Africa | Low Income | 4.29 | 56 | 3 | 2021 | Compare | |
| Singapore | East Asia & Pacific | High Income | 2.53 | 1 | 1 | 2021 | Compare | |
| Slovak Republic | Western Europe | High Income | 3.59 | 36 | 27 | 2021 | Compare | |
| Slovenia | Western Europe | High Income | 3.21 | 17 | 11 | 2021 | Compare | |
| South Africa | Sub-Saharan Africa | Upper Middle Income | 3.87 | 44 | 2 | 2021 | Compare | |
| Spain | Western Europe | High Income | 3.41 | 25 | 19 | 2021 | Compare | |
| Sri Lanka | South Asia | Lower Middle Income | 4.48 | 62 | 1 | 2021 | Compare | |
| Sweden | Western Europe | High Income | 2.98 | 5 | 3 | 2021 | Compare | |
| Switzerland | Western Europe | High Income | 3.27 | 20 | 14 | 2021 | Compare | |
| Thailand | East Asia & Pacific | Upper Middle Income | 5.45 | 87 | 11 | 2021 | Compare | |
| Trinidad And Tobago | Latin America & Caribbean | High Income | 3.66 | 39 | 3 | 2021 | Compare | |
| Tunisia | Middle East and North Africa | Lower Middle Income | 4.97 | 77 | 10 | 2021 | Compare | |
| Turkey | Central Eastern Europe and Central Asia | Upper Middle Income | 4.94 | 76 | 4 | 2021 | Compare | |
| Ukraine | Central Eastern Europe and Central Asia | Lower Middle Income | 3.82 | 43 | 1 | 2021 | Compare | |
| United Arab Emirates | Middle East and North Africa | High Income | 3.81 | 42 | 1 | 2021 | Compare | |
| United Kingdom | Western Europe | High Income | 2.88 | 4 | 2 | 2021 | Compare | |
| United States | North America | High Income | 4.16 | 51 | 2 | 2021 | Compare | |
| Uruguay | Latin America & Caribbean | High Income | 4.24 | 55 | 10 | 2021 | Compare | |
| Vietnam | East Asia & Pacific | Lower Middle Income | 4.53 | 65 | 7 | 2021 | Compare | |
| Zimbabwe | Sub-Saharan Africa | Lower Middle Income | 5.37 | 85 | 11 | 2021 | Compare | |
| Botswana | Sub-Saharan Africa | Upper Middle Income | 5.37 | No Data | No Data | 2019 | Compare | |
| Egypt | Middle East and North Africa | Lower Middle Income | 5.37 | No Data | No Data | 2019 | Compare | |
| Kenya | Sub-Saharan Africa | Lower Middle Income | 5.37 | No Data | No Data | 2019 | Compare | |
| Mauritius | Sub-Saharan Africa | High Income | 5.37 | No Data | No Data | 2019 | Compare | |
| Ukraine | Central Eastern Europe and Central Asia | Lower Middle Income | 5.37 | No Data | No Data | 2019 | Compare | |
| United Arab Emirates | Middle East and North Africa | High Income | 5.37 | No Data | No Data | 2019 | Compare | |
| Benin | Sub-Saharan Africa | Lower Middle Income | 5.37 | No Data | No Data | 2021 | Compare | |
| Burundi | Sub-Saharan Africa | Low Income | 5.37 | No Data | No Data | 2021 | Compare | |
| Dominican Republic | Latin America & Caribbean | Upper Middle Income | 5.37 | No Data | No Data | 2021 | Compare | |
| El Salvador | Latin America & Caribbean | Lower Middle Income | 5.37 | No Data | No Data | 2021 | Compare | |
| Georgia | Central Eastern Europe and Central Asia | Upper Middle Income | 5.37 | No Data | No Data | 2021 | Compare | |
| Haiti | Latin America & Caribbean | Lower Middle Income | 5.37 | No Data | No Data | 2021 | Compare | |
| Iceland | Western Europe | High Income | 5.37 | No Data | No Data | 2021 | Compare | |
| Jamaica | Latin America & Caribbean | Upper Middle Income | 5.37 | No Data | No Data | 2021 | Compare | |
| Madagascar | Sub-Saharan Africa | Low Income | 5.37 | No Data | No Data | 2021 | Compare | |
| Moldova | Central Eastern Europe and Central Asia | Upper Middle Income | 5.37 | No Data | No Data | 2021 | Compare | |
| Norway | Western Europe | High Income | 5.37 | No Data | No Data | 2021 | Compare | |
| Taiwan | East Asia & Pacific | High Income | 5.37 | No Data | No Data | 2021 | Compare | |
| Uganda | Sub-Saharan Africa | Low Income | 5.37 | No Data | No Data | 2021 | Compare | |
| Argentina | Latin America & Caribbean | High Income | 4.9 | 80 | 15 | 2023 | Compare | |
| Armenia | Central Eastern Europe and Central Asia | Upper Middle Income | 4.67 | 75 | 5 | 2023 | Compare | |
| Australia | East Asia & Pacific | High Income | 4.67 | 6 | 5 | 2023 | Compare | |
| Austria | Western Europe | High Income | 3.54 | 24 | 12 | 2023 | Compare | |
| Bahrain | Middle East and North Africa | High Income | 4.01 | 54 | 5 | 2023 | Compare | |
| Belgium | Western Europe | High Income | 3.65 | 34 | 19 | 2023 | Compare | |
| Benin | Sub-Saharan Africa | Lower Middle Income | 4.21 | 63 | 5 | 2023 | Compare | |
| Brazil | Latin America & Caribbean | Upper Middle Income | 4.81 | 79 | 14 | 2023 | Compare | |
| Bulgaria | Western Europe | Upper Middle Income | 4.07 | 58 | 29 | 2023 | Compare | |
| Burundi | Sub-Saharan Africa | Low Income | 4.12 | 59 | 3 | 2023 | Compare | |
| Canada | North America | High Income | 2.9 | 4 | 1 | 2023 | Compare | |
| Chile | Latin America & Caribbean | High Income | 3.17 | 10 | 1 | 2023 | Compare | |
| China | East Asia & Pacific | Upper Middle Income | 4.8 | 78 | 10 | 2023 | Compare | |
| Colombia | Latin America & Caribbean | Upper Middle Income | 3.34 | 16 | 3 | 2023 | Compare | |
| Costa Rica | Latin America & Caribbean | Upper Middle Income | 3.28 | 13 | 2 | 2023 | Compare | |
| Croatia | Western Europe | High Income | 3.87 | 43 | 24 | 2023 | Compare | |
| Cyprus | Western Europe | High Income | 3.85 | 42 | 22 | 2023 | Compare | |
| Czech Republic | Western Europe | High Income | 3.42 | 20 | 8 | 2023 | Compare | |
| Denmark | Western Europe | High Income | 3.24 | 12 | 5 | 2023 | Compare | |
| Dominican Republic | Latin America & Caribbean | Upper Middle Income | 3.57 | 26 | 7 | 2023 | Compare | |
| Ecuador | Latin America & Caribbean | Upper Middle Income | 3.91 | 48 | 11 | 2023 | Compare | |
| Egypt | Middle East and North Africa | Lower Middle Income | 5.28 | 84 | 9 | 2023 | Compare | |
| El Salvador | Latin America & Caribbean | Lower Middle Income | 3.41 | 18 | 5 | 2023 | Compare | |
| Estonia | Western Europe | High Income | 3.61 | 30 | 15 | 2023 | Compare | |
| Finland | Western Europe | High Income | 3.54 | 25 | 11 | 2023 | Compare | |
| France | Western Europe | High Income | 3.57 | 27 | 13 | 2023 | Compare | |
| Georgia | Central Eastern Europe and Central Asia | Upper Middle Income | 3.83 | 40 | 1 | 2023 | Compare | |
| Germany | Western Europe | High Income | 3.18 | 11 | 4 | 2023 | Compare | |
| Greece | Western Europe | High Income | 4.19 | 62 | 30 | 2023 | Compare | |
| Guatemala | Latin America & Caribbean | Upper Middle Income | 3.49 | 22 | 6 | 2023 | Compare | |
| Haiti | Latin America & Caribbean | Lower Middle Income | 3.71 | 35 | 9 | 2023 | Compare | |
| Hong Kong | East Asia & Pacific | High Income | 2.96 | 5 | 4 | 2023 | Compare | |
| Hungary | Western Europe | High Income | 4.03 | 55 | 28 | 2023 | Compare | |
| Iceland | Western Europe | High Income | 3.61 | 31 | 16 | 2023 | Compare | |
| India | South Asia | Lower Middle Income | 5.99 | 88 | 3 | 2023 | Compare | |
| Indonesia | East Asia & Pacific | Lower Middle Income | 5.47 | 86 | 13 | 2023 | Compare | |
| Ireland | Western Europe | High Income | 3.37 | 17 | 7 | 2023 | Compare | |
| Israel | Middle East and North Africa | High Income | 3.31 | 15 | 1 | 2023 | Compare | |
| Italy | Western Europe | High Income | 3.92 | 49 | 26 | 2023 | Compare | |
| Jamaica | Latin America & Caribbean | Upper Middle Income | 3.59 | 29 | 8 | 2023 | Compare | |
| Japan | East Asia & Pacific | High Income | 2.78 | 3 | 3 | 2023 | Compare | |
| Jordan | Middle East and North Africa | Upper Middle Income | 3.89 | 46 | 3 | 2023 | Compare | |
| Kazakhstan | Central Eastern Europe and Central Asia | Upper Middle Income | 4.68 | 76 | 6 | 2023 | Compare | |
| Kenya | Sub-Saharan Africa | Lower Middle Income | 3.97 | 52 | 2 | 2023 | Compare | |
| Korea, Rep. | East Asia & Pacific | High Income | 4.54 | 71 | 8 | 2023 | Compare | |
| Kuwait | Middle East and North Africa | High Income | 4.06 | 57 | 6 | 2023 | Compare | |
| Latvia | Western Europe | High Income | 3.62 | 32 | 17 | 2023 | Compare | |
| Lithuania | Western Europe | High Income | 3.63 | 33 | 18 | 2023 | Compare | |
| Luxembourg | Western Europe | High Income | 3.58 | 28 | 14 | 2023 | Compare | |
| Madagascar | Sub-Saharan Africa | Low Income | 4.36 | 68 | 7 | 2023 | Compare | |
| Malaysia | East Asia & Pacific | Upper Middle Income | 3.88 | 45 | 6 | 2023 | Compare | |
| Malta | Western Europe | High Income | 3.89 | 47 | 25 | 2023 | Compare | |
| Mexico | Latin America & Caribbean | Upper Middle Income | 3.84 | 41 | 10 | 2023 | Compare | |
| Moldova | Central Eastern Europe and Central Asia | Upper Middle Income | 4.41 | 70 | 3 | 2023 | Compare | |
| Morocco | Middle East and North Africa | Lower Middle Income | 5.2 | 82 | 8 | 2023 | Compare | |
| Nepal | South Asia | Low Income | 5.22 | 83 | 2 | 2023 | Compare | |
| Netherlands | Western Europe | High Income | 3.11 | 9 | 3 | 2023 | Compare | |
| New Zealand | East Asia & Pacific | High Income | 2.74 | 2 | 2 | 2023 | Compare | |
| Norway | Western Europe | High Income | 3.02 | 7 | 1 | 2023 | Compare | |
| Oman | Middle East and North Africa | High Income | 3.97 | 53 | 4 | 2023 | Compare | |
| Paraguay | Latin America & Caribbean | Upper Middle Income | 4.03 | 56 | 12 | 2023 | Compare | |
| Peru | Latin America & Caribbean | Upper Middle Income | 3.41 | 19 | 4 | 2023 | Compare | |
| Philippines | East Asia & Pacific | Lower Middle Income | 5.15 | 81 | 11 | 2023 | Compare | |
| Poland | Western Europe | High Income | 4.21 | 64 | 31 | 2023 | Compare | |
| Portugal | Western Europe | High Income | 3.52 | 23 | 10 | 2023 | Compare | |
| Romania | Western Europe | Upper Middle Income | 3.87 | 44 | 23 | 2023 | Compare | |
| Russian | Central Eastern Europe and Central Asia | Upper Middle Income | 5.53 | 87 | 7 | 2023 | Compare | |
| Saudi Arabia | Middle East and North Africa | High Income | 4.64 | 73 | 7 | 2023 | Compare | |
| Senegal | Sub-Saharan Africa | Low Income | 4.34 | 66 | 6 | 2023 | Compare | |
| Singapore | East Asia & Pacific | High Income | 2.57 | 1 | 1 | 2023 | Compare | |
| Slovak Republic | Western Europe | High Income | 3.79 | 37 | 21 | 2023 | Compare | |
| Slovenia | Western Europe | High Income | 3.96 | 50 | 27 | 2023 | Compare | |
| South Africa | Sub-Saharan Africa | Upper Middle Income | 3.8 | 38 | 1 | 2023 | Compare | |
| Spain | Western Europe | High Income | 3.3 | 14 | 6 | 2023 | Compare | |
| Sri Lanka | South Asia | Lower Middle Income | 4.34 | 67 | 1 | 2023 | Compare | |
| Sweden | Western Europe | High Income | 3.48 | 21 | 9 | 2023 | Compare | |
| Switzerland | Western Europe | High Income | 3.75 | 36 | 20 | 2023 | Compare | |
| Taiwan | East Asia & Pacific | High Income | 3.96 | 51 | 7 | 2023 | Compare | |
| Thailand | East Asia & Pacific | Upper Middle Income | 5.42 | 85 | 12 | 2023 | Compare | |
| Turkey | Central Eastern Europe and Central Asia | Upper Middle Income | 4.64 | 74 | 4 | 2023 | Compare | |
| Uganda | Sub-Saharan Africa | Low Income | 4.15 | 61 | 4 | 2023 | Compare | |
| Ukraine | Central Eastern Europe and Central Asia | Lower Middle Income | 4.36 | 69 | 2 | 2023 | Compare | |
| United Arab Emirates | Middle East and North Africa | High Income | 3.8 | 39 | 2 | 2023 | Compare | |
| United Kingdom | Western Europe | High Income | 3.06 | 8 | 2 | 2023 | Compare | |
| United States | North America | High Income | 4.23 | 65 | 2 | 2023 | Compare | |
| Uruguay | Latin America & Caribbean | High Income | 4.14 | 60 | 13 | 2023 | Compare | |
| Vietnam | East Asia & Pacific | Lower Middle Income | 4.75 | 77 | 9 | 2023 | Compare | |
| Zimbabwe | Sub-Saharan Africa | Lower Middle Income | 4.55 | 72 | 8 | 2023 | Compare | |
| Central African Republic | Sub-Saharan Africa | Low Income | 5.15 | 113 | 24 | 2025 | Compare | |
| Chile | Latin America & Caribbean | High Income | 3.51 | 19 | 4 | 2025 | Compare | |
| China | East Asia & Pacific | Upper Middle Income | 5.16 | 114 | 11 | 2025 | Compare | |
| Colombia | Latin America & Caribbean | Upper Middle Income | 3.73 | 36 | 6 | 2025 | Compare | |
| Democratic Republic Of The Congo | Sub-Saharan Africa | Low Income | 4.83 | 92 | 14 | 2025 | Compare | |
| Costa Rica | Latin America & Caribbean | Upper Middle Income | 3.47 | 16 | 3 | 2025 | Compare | |
| Côte D'ivoire | Sub-Saharan Africa | Lower Middle Income | 4.93 | 102 | 19 | 2025 | Compare | |
| Croatia | Western Europe | High Income | 4.05 | 53 | 25 | 2025 | Compare | |
| Cyprus | Western Europe | High Income | 4.04 | 52 | 24 | 2025 | Compare | |
| Czech Republic | Western Europe | High Income | 3.67 | 30 | 11 | 2025 | Compare | |
| Denmark | Western Europe | High Income | 3.42 | 14 | 5 | 2025 | Compare | |
| Dominican Republic | Latin America & Caribbean | Upper Middle Income | 4.06 | 54 | 10 | 2025 | Compare | |
| Ecuador | Latin America & Caribbean | Upper Middle Income | 4.35 | 70 | 16 | 2025 | Compare | |
| Egypt | Middle East and North Africa | Lower Middle Income | 4.59 | 82 | 10 | 2025 | Compare | |
| Albania | Central Eastern Europe and Central Asia | Upper Middle Income | 4.48 | 77 | 4 | 2025 | Compare | |
| Antigua And Barbuda | Latin America & Caribbean | High Income | 4.48 | 48 | 7 | 2025 | Compare | |
| France | Western Europe | High Income | 3.71 | 35 | 16 | 2025 | Compare | |
| Gambia | Sub-Saharan Africa | Low Income | 5.03 | 110 | 23 | 2025 | Compare | |
| Georgia | Central Eastern Europe and Central Asia | Upper Middle Income | 3.86 | 43 | 1 | 2025 | Compare | |
| Germany | Western Europe | High Income | 3.45 | 15 | 6 | 2025 | Compare | |
| Ghana | Sub-Saharan Africa | Lower Middle Income | 4.95 | 103 | 20 | 2025 | Compare | |
| Greece | Western Europe | High Income | 4.12 | 56 | 27 | 2025 | Compare | |
| Guatemala | Latin America & Caribbean | Upper Middle Income | 4.12 | 57 | 12 | 2025 | Compare | |
| Guinea | Sub-Saharan Africa | Lower Middle Income | 4.12 | 107 | 21 | 2025 | Compare | |
| Guyana | Latin America & Caribbean | High Income | 4.19 | 60 | 13 | 2025 | Compare | |
| Haiti | Latin America & Caribbean | Lower Middle Income | 4.54 | 79 | 19 | 2025 | Compare | |
| Honduras | Latin America & Caribbean | Lower Middle Income | 4.29 | 66 | 15 | 2025 | Compare | |
| Hong Kong | East Asia & Pacific | High Income | 2.69 | 1 | 1 | 2025 | Compare | |
| Hungary | Western Europe | High Income | 4.26 | 65 | 30 | 2025 | Compare | |
| Iceland | Western Europe | High Income | 4.16 | 59 | 28 | 2025 | Compare | |
| India | South Asia | Lower Middle Income | 5.72 | 120 | 3 | 2025 | Compare | |
| Indonesia | East Asia & Pacific | Lower Middle Income | 5.84 | 122 | 15 | 2025 | Compare | |
| Ireland | Western Europe | High Income | 3.52 | 21 | 8 | 2025 | Compare | |
| Israel | Middle East and North Africa | High Income | 3.04 | 3 | 1 | 2025 | Compare | |
| Italy | Western Europe | High Income | 4.02 | 50 | 23 | 2025 | Compare | |
| Jamaica | Latin America & Caribbean | Upper Middle Income | 4.1 | 55 | 11 | 2025 | Compare | |
| Japan | East Asia & Pacific | High Income | 3.07 | 5 | 4 | 2025 | Compare | |
| Jordan | Middle East and North Africa | Upper Middle Income | 3.96 | 46 | 7 | 2025 | Compare | |
| Kazakhstan | Central Eastern Europe and Central Asia | Upper Middle Income | 4.9 | 99 | 6 | 2025 | Compare | |
| Kenya | Sub-Saharan Africa | Lower Middle Income | 4.74 | 89 | 10 | 2025 | Compare | |
| Korea, Rep. | East Asia & Pacific | High Income | 4.61 | 85 | 9 | 2025 | Compare | |
| Kuwait | Middle East and North Africa | High Income | 3.66 | 29 | 6 | 2025 | Compare | |
| Kyrgyzstan | Central Eastern Europe and Central Asia | Lower Middle Income | 5.06 | 111 | 9 | 2025 | Compare | |
| Lao | East Asia & Pacific | Lower Middle Income | 4.8 | 91 | 10 | 2025 | Compare | |
| Latvia | Western Europe | High Income | 3.69 | 32 | 15 | 2025 | Compare | |
| Liberia | Sub-Saharan Africa | Low Income | 3.69 | 108 | 22 | 2025 | Compare | |
| Lithuania | Western Europe | High Income | 3.78 | 39 | 18 | 2025 | Compare | |
| Luxembourg | Western Europe | High Income | 3.53 | 23 | 9 | 2025 | Compare | |
| Madagascar | Sub-Saharan Africa | Low Income | 4.83 | 93 | 12 | 2025 | Compare | |
| Malawi | Sub-Saharan Africa | Low Income | 4.63 | 86 | 8 | 2025 | Compare | |
| Malaysia | East Asia & Pacific | Upper Middle Income | 3.73 | 37 | 7 | 2025 | Compare | |
| Mali | Sub-Saharan Africa | Low Income | 4.83 | 94 | 11 | 2025 | Compare | |
| Malta | Western Europe | High Income | 3.97 | 47 | 22 | 2025 | Compare | |
| Mauritius | Sub-Saharan Africa | High Income | 3.53 | 24 | 1 | 2025 | Compare | |
| Mexico | Latin America & Caribbean | Upper Middle Income | 4.01 | 49 | 8 | 2025 | Compare | |
| Moldova | Central Eastern Europe and Central Asia | Upper Middle Income | 4.45 | 74 | 2 | 2025 | Compare | |
| Mongolia | East Asia & Pacific | Upper Middle Income | 4.29 | 67 | 8 | 2025 | Compare | |
| Montenegro | Central Eastern Europe and Central Asia | Upper Middle Income | 4.46 | 75 | 3 | 2025 | Compare | |
| Morocco | Middle East and North Africa | Lower Middle Income | 5.1 | 112 | 13 | 2025 | Compare | |
| Mozambique | Sub-Saharan Africa | Low Income | 4.6 | 83 | 7 | 2025 | Compare | |
| Nepal | South Asia | Low Income | 4.79 | 90 | 2 | 2025 | Compare | |
| Netherlands | Western Europe | High Income | 3.26 | 8 | 1 | 2025 | Compare | |
| New Zealand | East Asia & Pacific | High Income | 3.07 | 6 | 3 | 2025 | Compare | |
| Nicaragua | Latin America & Caribbean | Lower Middle Income | 4.54 | 80 | 20 | 2025 | Compare | |
| Norway | Western Europe | High Income | 3.41 | 12 | 4 | 2025 | Compare | |
| Oman | Middle East and North Africa | High Income | 3.61 | 28 | 5 | 2025 | Compare | |
| Pakistan | Middle East and North Africa | Lower Middle Income | 4.6 | 84 | 11 | 2025 | Compare | |
| Panama | Latin America & Caribbean | High Income | 3.37 | 10 | 1 | 2025 | Compare | |
| Paraguay | Latin America & Caribbean | Upper Middle Income | 4.53 | 78 | 18 | 2025 | Compare | |
| Peru | Latin America & Caribbean | Upper Middle Income | 3.52 | 22 | 5 | 2025 | Compare | |
| Philippines | East Asia & Pacific | Lower Middle Income | 5.25 | 116 | 12 | 2025 | Compare | |
| Poland | Western Europe | High Income | 4.2 | 62 | 29 | 2025 | Compare | |
| Portugal | Western Europe | High Income | 3.59 | 27 | 10 | 2025 | Compare | |
| Qatar | Middle East and North Africa | High Income | 3.5 | 18 | 2 | 2025 | Compare | |
| Romania | Western Europe | Upper Middle Income | 3.89 | 45 | 21 | 2025 | Compare | |
| Russian | Central Eastern Europe and Central Asia | Upper Middle Income | 5.81 | 121 | 10 | 2025 | Compare | |
| Rwanda | Sub-Saharan Africa | Low Income | 4.21 | 63 | 4 | 2025 | Compare | |
| Saudi Arabia | Middle East and North Africa | High Income | 4.35 | 71 | 8 | 2025 | Compare | |
| Senegal | Sub-Saharan Africa | Low Income | 4.92 | 101 | 18 | 2025 | Compare | |
| Singapore | East Asia & Pacific | High Income | 2.78 | 2 | 2 | 2025 | Compare | |
| Slovak Republic | Western Europe | High Income | 3.84 | 42 | 20 | 2025 | Compare | |
| Slovenia | Western Europe | High Income | 4.12 | 58 | 26 | 2025 | Compare | |
| South Africa | Sub-Saharan Africa | Upper Middle Income | 3.83 | 40 | 2 | 2025 | Compare | |
| Spain | Western Europe | High Income | 3.47 | 17 | 7 | 2025 | Compare | |
| Sri Lanka | South Asia | Lower Middle Income | 4.34 | 69 | 1 | 2025 | Compare | |
| Sweden | Western Europe | High Income | 3.83 | 41 | 19 | 2025 | Compare | |
| Switzerland | Western Europe | High Income | 3.41 | 13 | 3 | 2025 | Compare | |
| Taiwan | East Asia & Pacific | High Income | 3.56 | 26 | 6 | 2025 | Compare | |
| Tanzania | Sub-Saharan Africa | Lower Middle Income | 4.71 | 87 | 9 | 2025 | Compare | |
| Thailand | East Asia & Pacific | Upper Middle Income | 5.54 | 118 | 14 | 2025 | Compare | |
| Trinidad And Tobago | Latin America & Caribbean | High Income | 3.4 | 11 | 2 | 2025 | Compare | |
| Turkey | Central Eastern Europe and Central Asia | Upper Middle Income | 4.99 | 106 | 8 | 2025 | Compare | |
| Uganda | Sub-Saharan Africa | Low Income | 4.83 | 95 | 13 | 2025 | Compare | |
| Ukraine | Central Eastern Europe and Central Asia | Lower Middle Income | 4.84 | 96 | 5 | 2025 | Compare | |
| United Arab Emirates | Middle East and North Africa | High Income | 3.51 | 20 | 3 | 2025 | Compare | |
| Argentina | Latin America & Caribbean | High Income | 4.73 | 88 | 21 | 2025 | Compare | |
| El Salvador | Latin America & Caribbean | Lower Middle Income | 4.02 | 51 | 9 | 2025 | Compare | |
| Estonia | Western Europe | High Income | 3.68 | 31 | 12 | 2025 | Compare | |
| Eswatini | Sub-Saharan Africa | Lower Middle Income | 4.47 | 76 | 5 | 2025 | Compare | |
| Finland | Western Europe | High Income | 3.69 | 33 | 13 | 2025 | Compare | |
| Armenia | Central Eastern Europe and Central Asia | Upper Middle Income | 4.96 | 104 | 7 | 2025 | Compare | |
| Australia | East Asia & Pacific | High Income | 3.2 | 7 | 5 | 2025 | Compare | |
| Austria | Western Europe | High Income | 3.69 | 34 | 14 | 2025 | Compare | |
| Bahrain | Middle East and North Africa | High Income | 3.53 | 25 | 4 | 2025 | Compare | |
| Bangladesh | Middle East and North Africa | Lower Middle Income | 4.98 | 105 | 12 | 2025 | Compare | |
| Belgium | Western Europe | High Income | 3.76 | 38 | 17 | 2025 | Compare | |
| Benin | Sub-Saharan Africa | Lower Middle Income | 4.89 | 98 | 16 | 2025 | Compare | |
| Bolivia | Latin America & Caribbean | Lower Middle Income | 4.39 | 72 | 17 | 2025 | Compare | |
| Botswana | Sub-Saharan Africa | Upper Middle Income | 3.86 | 44 | 3 | 2025 | Compare | |
| Brazil | Latin America & Caribbean | Upper Middle Income | 3.86 | 109 | 22 | 2025 | Compare | |
| Bulgaria | Western Europe | Upper Middle Income | 4.29 | 68 | 31 | 2025 | Compare | |
| Burkina Faso | Sub-Saharan Africa | Low Income | 4.84 | 97 | 15 | 2025 | Compare | |
| Burundi | Sub-Saharan Africa | Low Income | 4.54 | 81 | 6 | 2025 | Compare | |
| Canada | North America | High Income | 3.05 | 4 | 1 | 2025 | Compare | |
| United Kingdom | Western Europe | High Income | 3.33 | 9 | 2 | 2025 | Compare | |
| United States | North America | High Income | 4.19 | 61 | 2 | 2025 | Compare | |
| Uruguay | Latin America & Caribbean | High Income | 4.22 | 64 | 14 | 2025 | Compare | |
| Venezuela | Latin America & Caribbean | Upper Middle Income | 5.56 | 119 | 23 | 2025 | Compare | |
| Vietnam | East Asia & Pacific | Lower Middle Income | 5.36 | 117 | 13 | 2025 | Compare | |
| Yemen | Middle East and North Africa | Low Income | 4.42 | 73 | 9 | 2025 | Compare | |
| Zambia | Sub-Saharan Africa | Lower Middle Income | 4.91 | 100 | 17 | 2025 | Compare | |
| Zimbabwe | Sub-Saharan Africa | Lower Middle Income | 5.18 | 115 | 25 | 2025 | Compare |